Research and Statistical Terminology:
A Clinical Approach

As therapists, you will need to be able to access the large database of research related to occupational therapy practice.
The following charts will review the process and terminology behind using research in your occupational therapy practice.
Definition: The meticulous use of current, research-based evidence when making decisions regarding patient care.
Why evidence-based practice is important:
A. Therapeutic practices that are based on the results of current, quality research, provide validity to treatment and to the profession in general.
B. Evidence-based practice is easier to justify to patients, physicians, and insurance companies.
C. Therapists who use evidence-based practice will further their knowledge and skills in occupational therapy, allowing them to provide higher quality treatment to their clients.
Basic steps for using research in practice:
A. Formulate a question regarding the intervention you want to use.
B. Review the best evidence available in the literature
i. Most current publications
ii. Best research design
C. Determine the validity, reliability and clinical application of each research study
D. Determine the usefulness and support of information as it pertains to your question and clinical practice.
E. Base your treatment approaches on the evidence that meets your criteria for research topic, design, and quality.
Patient Intervention Comparison Outcome (PICO)
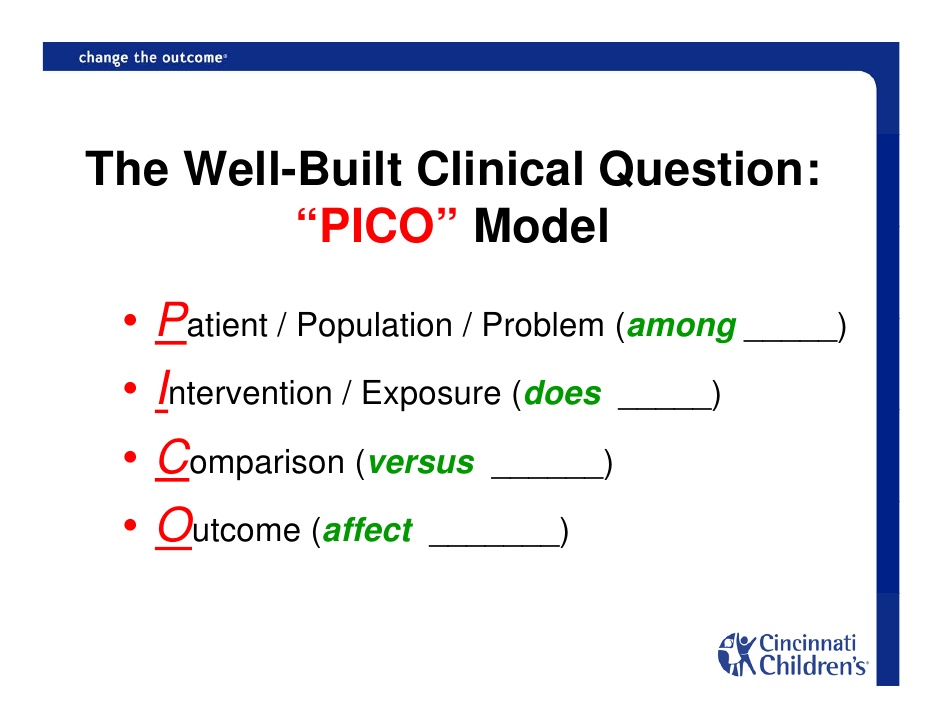
PICO: A mnemonic to help formulate a clinical question and a search strategy by identifying key concepts.
PICO allows you to develop focused relevant questions. The Centre for Evidence Based Medicine states that “one of the fundamental skills required for practicing EBM is the asking of well-built clinical questions. To benefit patients and clinicians, such questions need to be both directly relevant to patients’ problems and phrased in ways that direct your search to relevant and precise answers”.
Characteristics of PICO Questions include:
1. Structures and guides the search for literature evidence
2. Promotes a relevant, direct, and clear search
3. Answers- what do I want to know about?
4. Focuses the question by identifying the components in the question
5. Defines the concepts that will be used when performing a complex literature search
6. Promotes access to professional evidence that is relevant to the question
7. Determines if the identified evidence is able to effectively address the question
8. Focuses on elements to support and update clinical practice
9. Provides the information needed to make a decision whether or not the intervention in the PICO question should be implemented
PICO– a question formula that allows you to define your research question and determine the key components of your research.
| P | Patient/Population/Problem | Describe your patient or the problem – be specific |
| I | Intervention/Indicator | Treatment, cause, prognostic factor, etc. |
| C | Comparison/Control | Compared to another treatment or standard of care (optional) |
| O | Outcome | Improvement or negative effects? |
P: Population / Patient
Who or What? Patient, Population, Problem.
How would you describe a group of patients similar to your group?
What are the most important characteristics of the patient? Primary problem; disease; co-existing conditions.
Consider sex, age and/or race of a patient as this may be relevant to the diagnosis or treatment of a disease.
I: Intervention / Indicator
How: Intervention, prognostic factor or exposure – Drug, procedure, diagnostic test, exposure.
Which main intervention, prognostic factor, exposure are you considering?
What do you want to do for the patient? Prescribe a drug? Order a test? Order surgery?
What factor might influence the prognosis of the patient? Age; co-existing problems.
What exposure has the patient experienced? Asbestos; cigarette smoke.
C: Comparator / Control
What is the main alternative? Comparison or intervention?
What is the main alternative to compare with the intervention?
Are you trying to decide between? Two drugs; a drug and no medication or placebo; two diagnostic tests.
Your clinical question may not always need a specific comparison.
O: Outcome
What are you trying to accomplish, measure, improve, effect, achieve?
What can you hope to accomplish measure, improve or affect?
What are you trying to do for the patient? Relieve or eliminate the symptoms; reduce the number of adverse events; improve function or test scores.
Always evaluate the outcomes in regard to the current issue and to future situations.
It is important to note that not all questions have the “C” component. Perhaps you are not comparing the intervention you are interested in with another intervention. For example in the above PICO, perhaps there isn’t a comparison with NDT patterns and you are inquiring about the effectiveness of constraint induced movement therapy only. Your question would be considered a PIO question.
Examples of PICO
1. You have a patient who has difficulty exercising due to COPD and you wonder if pursed lip breathing techniques may improve their endurance.
P = patients with COPD
I = pursed lip breathing
C = regular breathing
O = improved exercise endurance
“In patients with COPD, does using pursed lip breathing, as compared to regular breathing, improve exercise endurance?”
2. You are working with a recent stroke patient who is having balance issues and you are considering using virtual reality in their therapy.
P = recent stroke, balance issues
I = virtual reality
C = no virtual reality
O = improved balance
“In recent stroke patients, how does using virtual reality affect or improve balance?”
Needs Assessment
A Needs Assessment is the systematic collection, assembly, analysis and dissemination of information on the health of a community. There are a number of different ways that the needs assessment can be conducted. No matter the method that is used, the results should be the same. Most often, a combination of techniques will be used.
An important first step in developing any program is to conduct a thorough needs assessment of the intended community setting in order to evaluate the need for such a program as well as the specific individualized needs of the target population.
Typically, there are a number of questions that guide the assessment. The following questions should be answered:
• Who is requesting the change?
• What is the change that is being asked for?
• When does the change need to be implemented?
3 components of the needs assessment process include:
I. Profiling the Population and Community
II. Data Collection
III. Data Analysis/Interpretation
A needs assessment process involves:
• Collecting the relevant data
• Analyzing the data and synthesizing it
• Strength Weaknesses Opportunities Threats (SWOT) analysis
• Determining the priorities
• Evaluating and identifying alternative solutions
• Creating a plan of action
Data gathering methods in a needs assessment can consist of the following:
• Individual interviews
• Questionnaires and surveys
• Focus Groups
• Independent research
• Observation.
Information to be considered in the collection of data includes:
• Facts about the potential clients and existing services in the area
• The demographics of the population being targeted (including statistics)
• The percentage of individuals over the age of 65 in the area
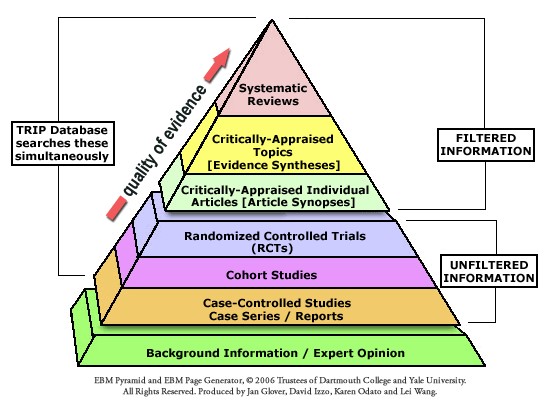
Types of Research and Hierarchy of Evidence
Different types of research are considered to be higher quality than others. Those that are considered to be the best are placed at the top of what is called the “hierarchy of evidence”. This chart will list the different types of research according to a general hierarchy of evidence, with the best types of research studies listed first. When conducting your own research, you will need to compile your own hierarchy of evidence based on the topic that you are researching.
There are two types of research outcomes:
1. Quantitative – objective measurements and statistical analysis are used in the research design
2. Qualitative – exploratory research to help gain an understanding of a problem or develop a hypothesis for a quantitative research study.
Quantitative research usually falls higher in the hierarchy of evidence than qualitative research.
More detail about quantitative and qualitative research will be provided in subsequent charts.
| Type of Research | Quantitative or Qualitative | Definition | Example from the Literature |
| 1. Meta-analysis of randomized controlled trials | Quantitative | Several studies that use randomized controlled trials are selected and statistically analyzed to compare and contrast the results of the studies. Conclusions regarding the outcomes of the research can be drawn from the results of the analysis. | Virtual Reality in Stroke Rehabilitation: A Meta-Analysis and Implications for Clinicians |
| 2. Randomized Controlled Trial | Quantitative | A group of subjects who are randomly selected for the study are split into a trial group and a control group. The groups are exactly the same except for the variable to be studied, which is changed for the trial group. –double blind trials are ranked higher in the hierarchy of evidence than other randomized controlled trials. |
Early physical and occupational therapy in mechanically ventilated, critically ill patients: a randomized controlled trial |
| 3. Longitudinal Study | Quantitative or qualitative | A variable is observed repeatedly over a long period of time, often years. –Cohort Study – a type of longitudinal study that follows a select group of people over a long period of time to analyze risk factors. Often uses life histories to determine risks for medical conditions. –Outcomes Study – research that studies the end results of health care services, including patients’ experiences, preferences and values. |
A Longitudinal Study of Factors Influencing Occupational Therapy Students’ Practice Preference from Pre-Admission Through Job Selection |
| 4. Case Control Study | Qualitative | An observational study where two groups of people, one with a specific medical condition and one without the condition, are compared to determine factors that may contribute to or affect the medical condition. | Is early occupational therapy in extremely preterm infants of benefit in the long run? |
| 5. Case Study | Qualitative | A single person, group of people, or specific situation is studied and analyzed holistically over a period of time. | A case study report : occupational therapy for an older adult with shoulder impingement syndrome |
| 6. Expert Opinion | Qualitative | A person with expertise in a particular subject relays their knowledge about that subject. | The Delphi Technique: An Adaptive Research Tool |
A research study compares variables against each other to determine their effects on each other.
Basic terms that you will need to know when studying research:
| Term | Definition | Examples |
| Independent variable | A variable that is not affected by other variables. -may be a demographic feature -may be a causative agent |
Demographic – age, gender, race Causative – medication, therapeutic intervention. -therapy treatment techniques are often independent variables. |
| Dependent variable | A variable that changes over the course of the research study. The outcome of the dependent variable is measured and analyzed. | Effects of medication, outcomes of therapeutic intervention on function. -the functional ability that a therapy treatment technique addresses is the dependent variable. |
| Covariation | A comparison of two or more variables that change in relation to each other. | The effect of amount of exercise on body weight. |
| Null Hypothesis | A default position in research that states the point of view that there is no relationship between two measurable phenomena. Disproving the null hypothesis, or concluding that there is a relationship between the two phenomena, allows the relationship to be measured. Rejecting or disproving the null hypothesis – and thus concluding that there are grounds for believing that there is a relationship between two phenomena or that a potential treatment has a measurable effect | A researcher hypothesizes that there is no relationship between pulley exercises and shoulder range of motion. A study on these two variables disproves the hypothesis, showing that there is a positive relationship between pulley exercises and shoulder range of motion. The researcher is able to measure the positive correlation. |
| Level of Significance (p value) | The probability of rejecting the null hypothesis when it is true. -if the p value is .05 or less, the null hypothesis can be confidently rejected. |
The p value of the study on the relationship between pulley exercises and shoulder range of motion is p=.035, therefore the null hypothesis is rejected. |
The psychometric properties of a test or assessment tool used in research include the reliability and validity of the tool.
The following chart defines psychometric properties that you will encounter when reading research.
| Term | Definition | Example from the Literature |
| Validity | The extent to which an assessment tool measures what it is supposed to measure. | Loewenstein Occupational Therapy Cognitive Assessment (LOTCA) Battery for Brain-Injured Patients: Reliability and Validity |
| Face Validity | The measure of how much an assessment tool subjectively seems to measure what it is supposed to measure. –this is the weakest form of validity |
Inter-rater reliability and face validity of the Executive Function Performance Test (EFPT) |
| Content Validity | The determination of whether or not the content that is measured includes all content that could be measured. Is the assessment tool comprehensive? | Examining Content Validity and Reliability of the Assessment of Children’s Hand Skills (ACHS): A Preliminary Study |
| Criterion Validity | The determination of how well an assessment tool measures an outcome. There are two types of criterion validity: 1. Concurrent validity – compares an assessment tool to the outcomes of another assessment tool with established validity when both assessments are administered at the same time. 2. Predictive validity – determines whether or not an assessment tool is able to predict an outcome that is measured at a later time. |
Criterion-Related Validity of the Children ‘ s Occupational Performance Questionnaire |
| Construct Validity | The determination of how well an assessment tool measures an attribute or skill that it claims to measure. | Content and Construct Validity of Here’s How I Write (HHIW): A Child’s Self-Assessment and Goal Setting Tool |
| Reliability | The ability to duplicate the results of an assessment: does the test provide the same results if administered under the same conditions. | Reliability and Validity of the Self-Assessment of Occupational Functioning |
| Inter-rater Reliability | The determination of how well an assessment tool achieves the same results if two different raters administer the tool. -measured on a scale of 0 to 1.0. -values closer to 1.0 indicate stronger inter-rater reliability. |
The inter rater reliability of the original and of the modified Ashworth scale for the assessment of spasticity in patients with spinal cord injury |
| Intra-rater Reliability | The determination of how well the results of an assessment can be replicated when it is administered by the same rater on two or more occasions. -the differences in results of the multiple administrations are compared through correlation. |
Inter-rater and Intra-rater Reliability of the Assisting Hand Assessment |
| Test-Retest Reliability | The determination of how well an assessment achieves the same results if the test is administered twice under the exact same conditions. | The Test–Retest Reliability of the Child-Initiated Pretend Play Assessment |

Qualitative research is a form of research that studies people, either individually or by groups, in different contexts. It is systematic but subjective. Observations are unstructured and settings are natural, so descriptions of observations are very detailed. The results of qualitative research keep changing, depending on the contexts observed.
| Type | Definition | Possible Subjects | Example from the Literature |
| Phenomenological | A study of how people react to and experience a phenomenon or a situation. | -How people perceive or experience aging. -The public’s perception of occupational therapyclass=”blur” -Focus group that survey’s perceptions of a new over-the-counter medication. |
Stigma and the delegitimation experience: An interpretative phenomenological analysis of people living with chronic fatigue syndrome |
| Ethnographic | A study of the characteristics of a cultural group. -usually includes roles, values, beliefs and typical practices -conducted through thorough observations of the members of the cultural group, as well as review of the literature and cultural immersion. |
-The study of the culture of a nursing home. -A workplace study of an inpatient hospital. |
An Ethnographic Study of Independent Living Alternatives |
| Heuristic | A study in which the researcher immerses himself or herself in the experience of the subjects. -goal is to understand and interpret the phenomenon or experience -meaning of the experience can only be understood if the researcher personally experiences it. |
-A study of meaningful occupations for people over age 65. | Meaning Making through Occupations and Occupational Roles: A Heuristic Study of Worker-Writer Histories |
| Case Study | An in-depth study of a single subject or group of subjects. | Early Intervention (Part C) Child Example Case Study: “Kim” at 17 Months of Age |

Quantitative research is research that uses two groups to compare the effects of a random variable. This type of research is structured so that an experimental group receives the experimental variable and the control group does not receive the experimental variable. The cause and effect relationship between the independent and dependent variables is examined and observations are structured or formal.
-In occupational therapy research, quantitative research uses random selection to assign patients into an experimental group that receives the treatment being studied, and a control group that receives no treatment.
| Type | Definition | Possible Subjects | Examples from the Literature |
| True Experimental | A study in which subjects are randomly assigned to an experimental group or a control group. The effects of an independent variable on a dependent variable given to the experimental group are compared to the control group. | -A study on the effects of occupational therapy treatment on patients with multiple sclerosis | An experimental study on an evaluation method for occupational therapy–the effectiveness of a newly developed computerized measurement system of finger function. |
| Grounded Theory | An inductive method of research in which data is collected first. The data is analyzed and then the hypothesis is drawn from the results of the analysis. -often misidentified as qualitative research |
-A study of patterns of collaboration between therapists and other health care professionals. | A Grounded Theory of Intuition among Occupational Therapists in Mental Health Practice |
| Quasi-experimental | A study in which the effects of an independent variable on a dependent variable are examined. This type of study does not include random assignment of subjects to experimental or control groups.
–Subjects are limited to a specific population, such as patients with Parkinson’s Disease or children with Down Syndrome. –Subjects are usually selected by convenience, such as patients who attend a community based mental health program. Random assignment to experimental and control groups is not possible due to small sample sizes or the nature of the variables studied. –Differs from non-experimental in that manipulation of the independent variable is possible. |
-A study of the effectiveness of a handwriting curriculum on first grade students. -A study on the use of weighted vests with children with autism. |
Improvement of functional independence of patients with acute schizophrenia through early occupational therapy: a pilot quasi-experimental controlled study. |
| Non-experimental or correlational | A study in which manipulation of the independent variable is not possible. Randomization and researcher control are also not possible. –Retrospective – studies data collected in the past –Prospective – studies data collected in the present time –Descriptive – investigates several variables at once and determines existing relationships between variables –Predictive – predict the variance in one or more variables due to natural reasons-Differs from quasi-experimental in that neither manipulation of variables or random assignment of subjects is possible. |
-A study which correlates occupational therapy treatment and perception of independence. | -A study which correlates occupational therapy treatment and perception of independence. |

Methodology includes how the sampling method for the study is determined.
Here are some terms related to sampling methods:
Z score – desired confidence level. Typical z-scores in research are as follows:
99% – z score =2.576
95% – z score = 1.96
90% – z score = 1.645
Confidence interval – a variable calculated by researchers to estimate how much of the sample falls within the parameters of the actual population scrutinized by the study. It is also called margin of error.
Sample Size: The ideal sample size for a study can be calculated using the following formula:
(z-score)2*SD*(1-SD)/(margin of error)2
Here is an example using a confidence level of 95%, a standard deviation of .5, and a margin of error of +/- 2%.
((1.96)2 x.5(.5))/(.02)2
(3.8416 x .25)/.00004
.9604/.00004
24,010 subjects needed
The smaller the margin of error, the larger the sample size needed. The same study using a margin of error of +/- 5% would only require 385 subjects.
The following chart will review sample methods.
| Method | Description | Example | Example from the Literature |
| Random Sample | A table of random numbers is used to select individuals. | A computer program that assigns numbers to a test population and randomly selects from those numbers. | Descriptive Study of Occupational Therapists’ Participation in Early Childhood Transitions |
| Systematic Sample | Individuals are selected from a list at specific intervals. | Every fifth number listed in a phone book is selected for a telephone survey. | Theory Use in Practice: A National Survey of Therapists Who Use the Model of Human Occupation |
| Stratified Random Sample | Individuals are selected from subgroups of a population based on pre-determined characteristics that serve the purpose of the study. | A study on the income of occupational therapists randomly selects a proportionate number of occupational therapists from each region of the United States. | The quality of care in occupational therapy: an assessment of selected Michigan hospitals. |
| Purposive Sample | Individuals are deliberately singled out and selected for a study. | Occupational therapists with 20 or more years of experience in pediatrics are selected for a study on sensory integration practice techniques. | Occupational Therapy for Children with Attention Deficit Hyperactivity Disorder (ADHD), Part 2: A Multicentre Evaluation of an Assessment and Treatment Package |
| Snowball Sampling, also called Network Sampling | Individuals who are selected based on the study criteria provide the names of other individuals who can meet the study criteria. | Occupational therapists who have participated in continuing education courses on mental health topics are selected for a study on the effectiveness of continuing education in mental health. These therapists provide the names of other therapists who attended the same continuing education courses. | A Survey of Occupational Therapy Practice in Beijing, China.
|
| Convenience Sample | Individuals who meet the criteria of the study are selected based on availability to the researcher. | An occupational therapist conducts a research study on the effectiveness of pencil grips, using her handwriting students as the study sample. | Occupational therapists’ reported experiences using weighted vests with children with specific developmental disorders. |
The following charts will review methods of statistical measurement, analysis, and interpretation of results.
| Level | Description | Example |
| Nominal Type | Distinguishes data by its name or type only, classifying all data in the study by categories. –Also called qualitative type, as classifications are usually qualitative. |
Gender, ethnicity, language, genre, style, biological species. |
| Ordinal Type | Places data in rank order but does not determine the degree of difference between data sets. -Dichotomous data – two opposite data sets. -Non-dichotomous data – a spectrum of data sets in rank order. |
Dichotomous data – sick vs. healthy, true vs. false, received occupational therapy vs. did not receive occupational therapy. Non-dichotomous data – an opinion measurement with data classified as “strongly agree”, “agree”, “neither agree nor disagree”, “disagree”, “strongly disagree”. |
| Interval Type | Allows for the degree of difference between items. Does not allow for an estimate of ratio between items. | Percentage – percentage of nursing home patients who receive occupational therapy services. Temperature – temperature at which patients benefit from fluidotherapy. |
| Ratio Type | The estimation of the ratio between a scale of a continuous quantity and a single unit of the same kind. The scale has a non-arbitrary zero value. | Angle – measurement of range of motion of the shoulder compared to a normative scale of shoulder range of motion measurements. Force – measurement of hand strength using a dynamometer compared to a normative scale of hand strength measurements taken with the same type of dynamometer. |
Correlation Coefficient
The correlation coefficient measures the linear relationship between two variables.
Pearson’s r value:
– Measures the strength and direction of the linear relationship between two variables.
– The two variables studied are labeled x and y.
– Calculated by dividing the covariance of the sample variables by the product of the standard deviations of the sample variables.
– The r value ranges from -1 to +1. The + and – sings indicate a positive or negative linear correlation.
| Type of Correlation | Description | Example | Example from the Literature |
| Positive correlation | A linear relationship in which as the value of variable x increases, so does the value of variable y. –expressed as a positive r value |
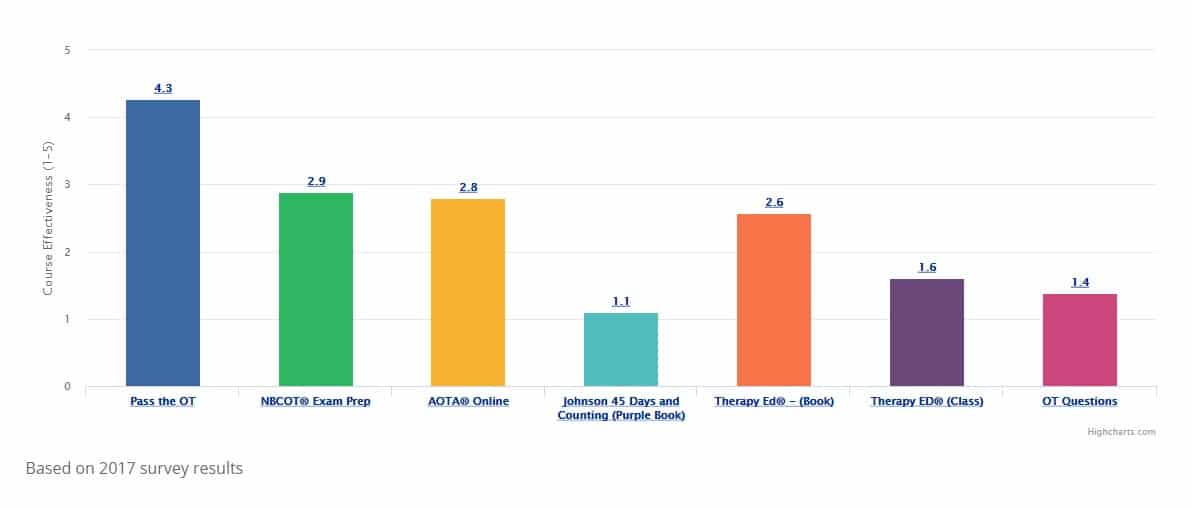
The more occupational therapy students use Pass the OT study materials, the higher their test scores are on the NBCOT® exam. | Effectiveness of occupational therapy following organ transplantation. |
| Negative correlation | A linear relationship in which as the value of variable x increases, the value of variable y decreases. –expressed as a negative r value. |
As fibromyalgia patients receive more occupational therapy sessions for pain management, their perceived levels of pain decrease. | Team Collaborative Practices Between Teachers and Occupational Therapists |
| No correlation | The linear relationship between variables x and y is weak or non-existent. –expressed as an r value of 0 or close to 0. –a correlation of r = .5 or less is considered a weak correlation. |
There is no relationship between the number of occupational therapy sessions a patient attends and the amount of coffee he drinks in the morning. | Fieldwork Performance and Academic Grades |
| Perfect correlation | All data points in a study lie exactly on a straight line. –expressed as an r value of +1 for a perfect positive correlation and -1 for a perfect negative correlation. –a correlation of r = .8 or higher is considered a strong correlation. |
There is a perfect correlation between an occupational therapist turning in her time card and receiving her paycheck. | The Work Environment Impact Scale (WEIS) – a first study |
Analysis and Interpretation of Data Using Descriptive Statistics
This section defines terms used when describing the results of data analysis through statistical methods.
Terms used to measure central tendencies:
–Mean: the mathematical average of all scores.
–Median: the midpoint of all scores. 50% of scores are higher than the median and 50% of scores are lower.
–Mode: the most frequently occurring score in the data set.
Terms used to measure variability and to determine the spread in a data set:
–Range: the difference between the highest score and the lowest score in the data set.
–Standard Deviation: the difference in a score from the mean of the data set. The measure determines the variability of scores in a data set.
–Normal Distribution: a symmetrical bell-shaped curve that shows the distribution of the scores in a data set.

Normal Distribution: “The Bell Curve”
Normal distribution appears in statistical analysis frequently. For many types of data sets, the data are distributed so that a few results are way above the mean, a few results are way below the mean, and the rest of the results are clustered at or near the mean. When data with normal distribution are plotted on a graph, the result is a bell-shaped curve.
Bell curves are frequently used when collecting and plotting normative data for standardized tests. When a test is administered by an occupational therapist, the scores on the test are compared to a normal distribution of normative data. This comparison tells the therapist whether the patient performed as expected on the test.
Here are some important points to remember about bell curves:
When using a bell curve to interpret a standardized test score, the interpretation manual should provide information on what score must be obtained to fall within certain areas on the bell curve. This is usually written as the standard deviation.
The authors of a standardized test will usually publish interpretation tables that will tell the person scoring the test how many standard deviations below the mean a score must fall to be considered significantly below the mean.
The standard deviation of a test score can be a helpful measure when determining if occupational therapy services are needed, but it should not be used as the only factor when considering the need for services.
Resources
http://www.occupationaltherapyevidencebasedpractice.com/step-1-develop-the-question.html
https://cabarruscollege.libguides.com/c.php?g=755865&p=5417982
https://libraryguides.griffith.edu.au/c.php?g=28801&p=177697
https://hslguides.osu.edu/ot_pt/pico
Address : 11777 San Vicente Blvd, Los Angeles, CA 90049 suite # 502
At the end of each month, Pass the OT awards $250 to one lucky user who fills out our brief exit survey.
This survey will be sent to you after you have taken the exam.
We look forward to helping you pass the near future
Begin ProgramPlease upgrade your package to view this quiz
UpgradePlease upgrade your package to view this quiz
UpgradePlease upgrade your package to view full page content
UpgradePlease upgrade your package to view full page content
UpgradeWhat is included
What is not included
What is included
What is not included